
Research

Original data studies.

Screens, rankings and market history produced with our own analysis engine. Every study states its universe, its extraction date and its limitations. None of it is a buy list.

Most investing content quotes a number without telling you where it came from. A study on Arcarios tells you before it tells you anything else.

Every piece in this section is produced with our own analysis engine, on data we pull and keep. That means we can say exactly which companies were in the sample, on which day the figures were frozen, and which filters were applied in which order.

It also means we can say what a study does not prove. Every one of them ends on its limits, because a result whose boundaries are hidden is not a result, it is a sales argument.

Two kinds of work appear here. Market history, where a crash or a bubble is taken apart year by year to see what the numbers actually did rather than what the story says they did. And screens, where a universe of stocks is ranked on a stated measure at a stated date.

A screen is a photograph, not a recommendation. Fundamentals move, prices move faster, and a ranking from last quarter describes last quarter. None of this is a buy list, and none of it is advice about your situation, which we do not know and never ask for.

2 published

The studies

market history 6 min read

The Dot-Com Bubble in Numbers

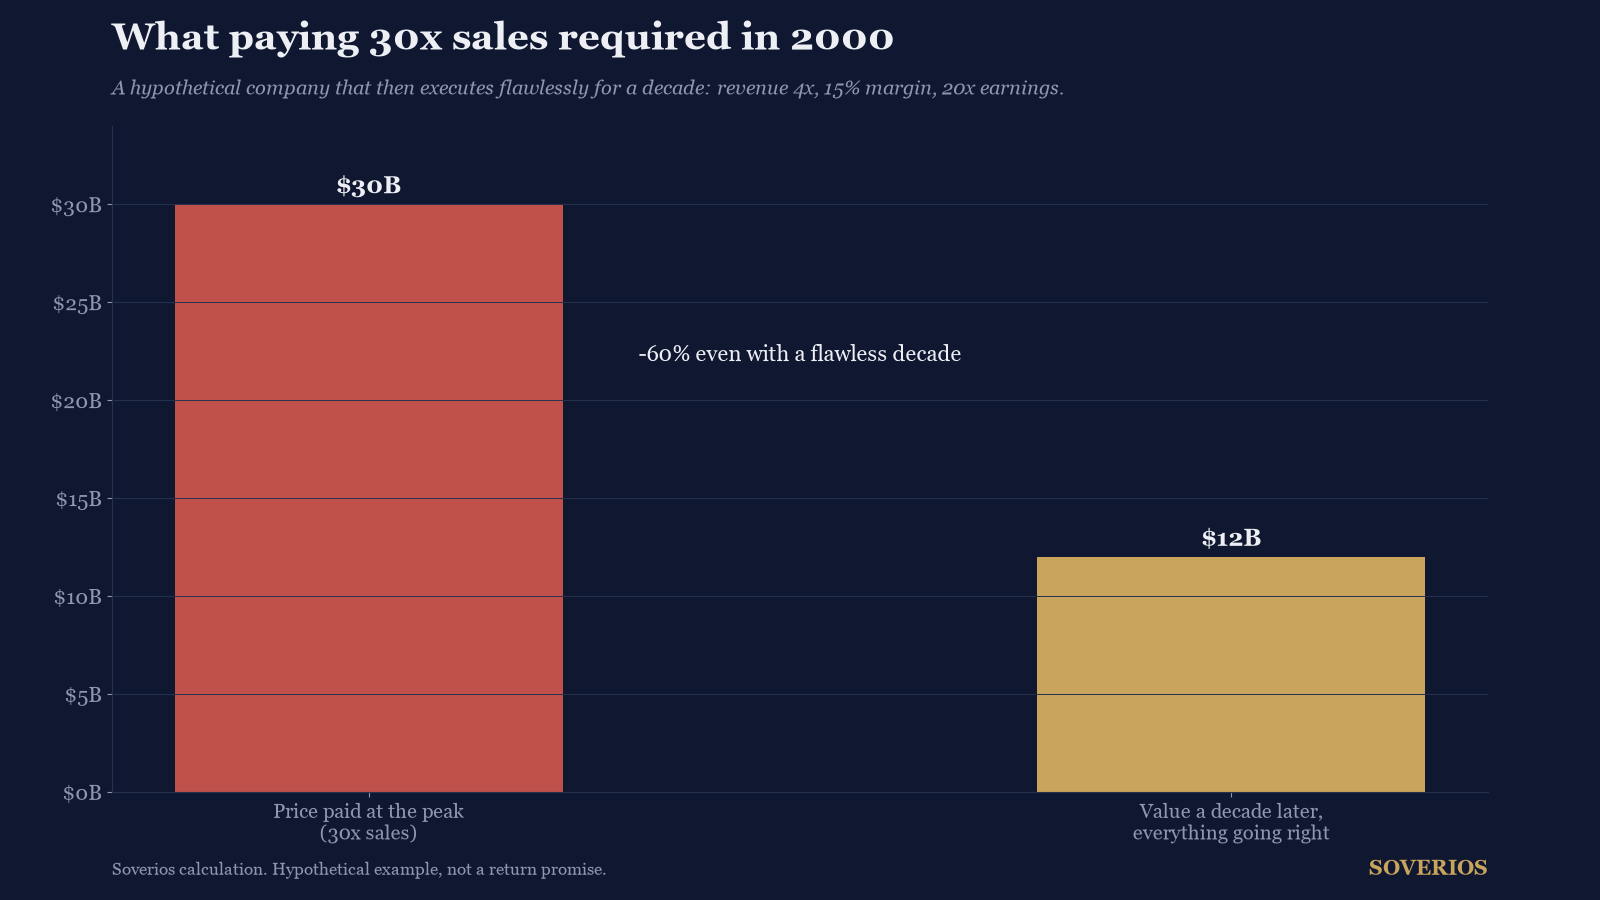
The dot-com bubble in verified numbers: the Nasdaq's 78 percent collapse, a 15 year round trip, and what it teaches stock pickers about valuation.

Key finding The Nasdaq Composite peaked at 5,048.62 on March 10, 2000 and fell almost 78 percent to about 1,114 by October 2002.

Universe
market history, dot-com bubble, valuation
Data as of
2026-08-30

market history 6 min read

Anatomy of the 2008 Crash: The Numbers Behind the Collapse

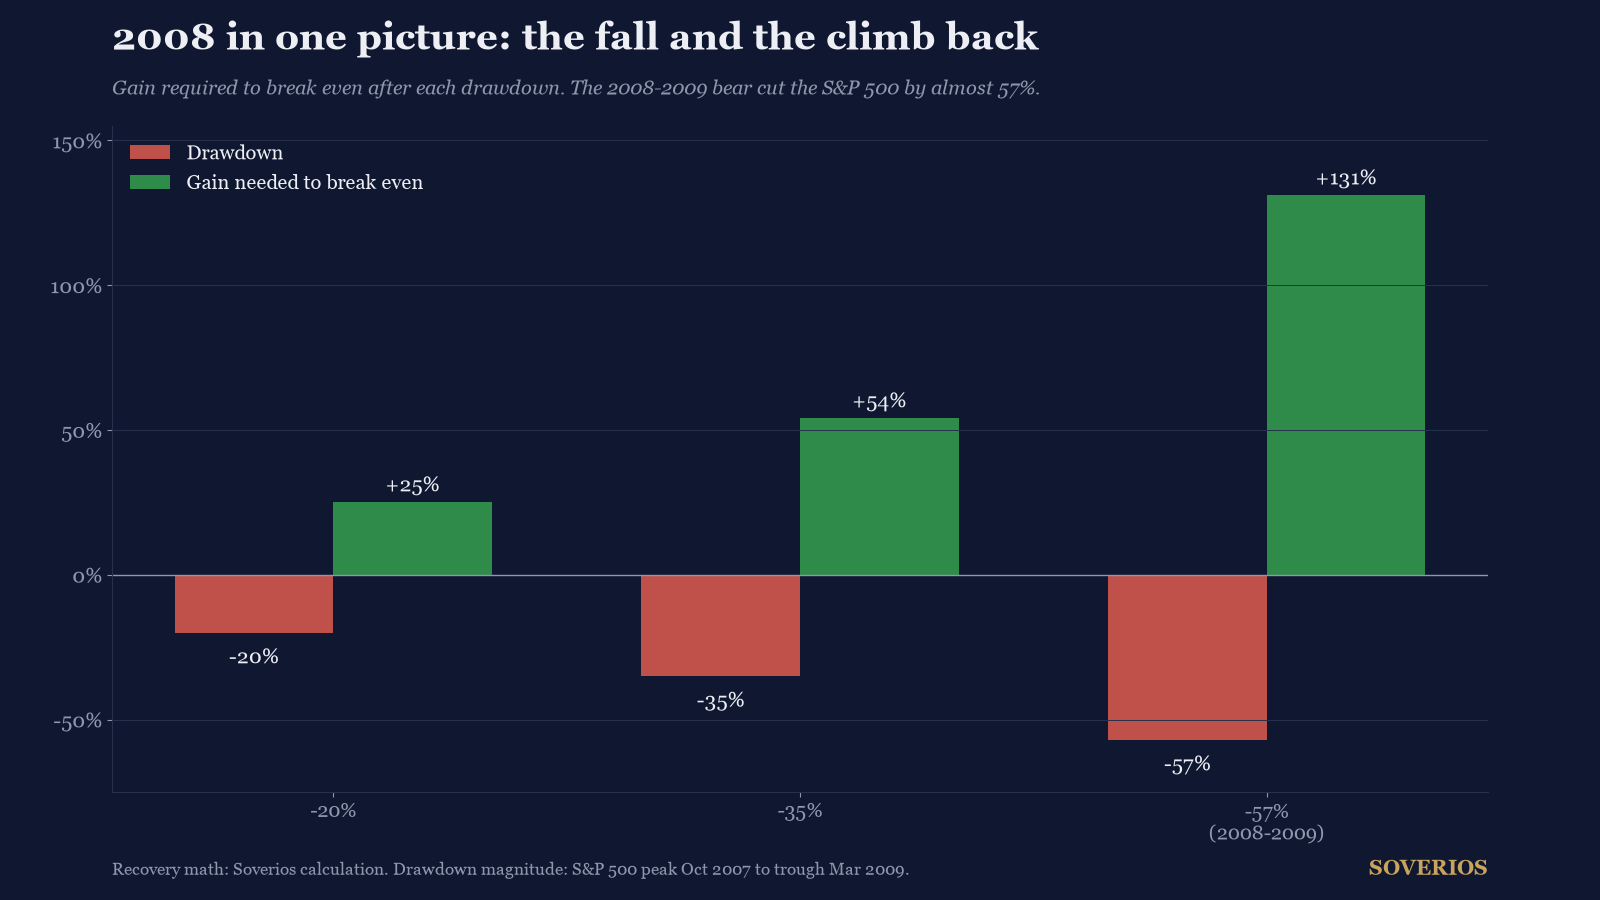
The 2008 crash in verified numbers: a 57 percent S&P 500 drawdown, an 18 month recession, and the recovery math every stock picker should know.

Key finding The S&P 500 fell almost 57 percent, from a peak near 1,565 in October 2007 to 676.5 on March 9, 2009.

Universe
market history, financial crisis, bear markets
Data as of
2026-08-30

Before you use one

How to read our studies

The universe

What was measured, and the boundary of the sample. A study of the S&P 500 says nothing about small caps.

The extraction date

The day the data was frozen. Fundamentals move; a ranking is a photograph, not a live feed.

The criteria

The filters applied, in order. Change the order or a threshold and you get a different list.

The limits

What the study cannot tell you. Every one of ours ends with this, because it is the part that protects you.