

Dividends
Are Dividend Aristocrats Worth It? What the Data Shows
What Dividend Aristocrats are, what the 25-year rule really filters for, and the math that decides when dividend growth beats high yield.
The library
The numbers behind serious investing. 27 articles, four ongoing investigations.
Featured · Foundations
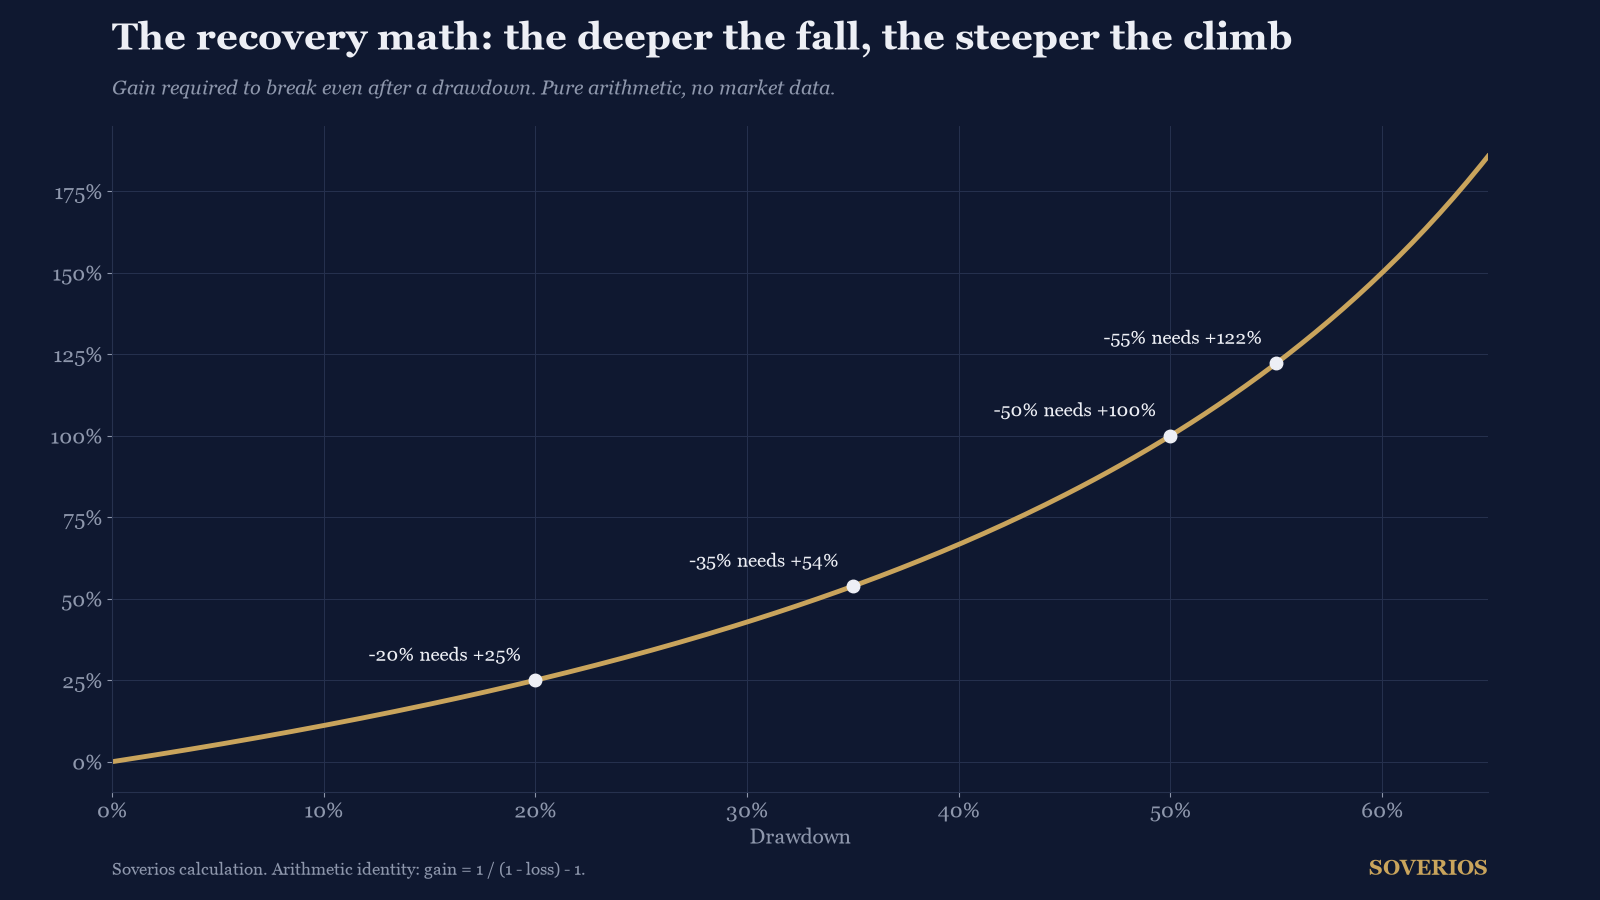
What bear market history shows: how deep the major declines went, how long they lasted, and what the recovery math demands from investors.
Start here
One entry guide per investigation. Read the guide, then go deep with the articles under it.
Everything
Dividends
What Dividend Aristocrats are, what the 25-year rule really filters for, and the math that decides when dividend growth beats high yield.
The Index Reality Check
Tracking difference is the gap between an index fund's return and its index. It often costs more than the expense ratio. Here is how to measure it.
Dividends
A high yield can signal a dividend about to be cut. Six warning signs, the payout math behind them, and a checklist to run before buying any high yielder.
Stock analysis
Stock-based compensation is a real expense that inflates free cash flow and dilutes shareholders. Here is how to measure what it really costs you.
Foundations
Doubling times, return gaps, and drawdown asymmetry: the compounding arithmetic that decides what a portfolio is worth in 30 years.
Stock analysis
A 12-metric checklist with indicative thresholds and where to find each number in the filings, so you can screen any stock in under an hour.
The Index Reality Check
Index funds guarantee the market return minus fees. The price: no valuation judgment, no right of refusal, and position sizes set by market cap.
Stock analysis
EV/EBITDA and P/E answer different questions. Here is when each valuation metric works, when it misleads, and how to use the two together.
Dividends
The payout ratio is the share of earnings paid out as dividends. Read it against cash flow and most dividend cuts announce themselves years in advance.
The Index Reality Check
A 1.00% expense ratio strips $66,254 from a hypothetical $100,000 portfolio over 20 years. The full math behind fee drag, with comparison tables.
Stock analysis
Free cash flow yield measures the cash a business generates against its market price. Here is how to calculate it and what counts as cheap.
Foundations
Lump sum investing usually beats dollar-cost averaging when markets rise. Here is the math on both, and when spreading purchases makes sense.
Stock analysis
A 30-minute reading plan for any 10-K: which sections to read first, what to skip, and the numbers to check before you buy a stock.
Dividends
A 20-year projection pits a 6% yielder growing 2% against a 2% yielder growing 10%. The grower wins the annual race in year 16 but not the total.
Stock analysis
Revenue growth and earnings growth can tell different stories. Here is which number is harder to fake and how to read the gap between them.
Stock analysis
Nine warning signs that show up in financial statements before a stock collapses, with the exact lines to check and worked examples for each.
The Index Reality Check
Cap weighting quietly concentrates the S&P 500 in a handful of giant companies. Here is the math behind it and what it means for your portfolio.
Foundations
Market timing looks smart until you price it. Here is the math on missed rebounds, annual drag, and what staying invested is actually worth.
Stock analysis
ROIC and ROE both measure returns, but debt can inflate ROE. Here is how each ratio works, where they diverge, and which one better captures business quality.
The Index Reality Check
Risk falls fast up to 10 stocks, then barely moves: 500 holdings cut volatility only 1.3 points below 20. The math both camps should know.
Dividends Start here
How to pick dividend stocks that keep paying: yield vs growth, payout ratios, traps, Aristocrats, and US taxes, with the numbers that matter at each step.
Stock analysis
An economic moat is a durable competitive advantage. Here is how to spot one in gross margins, ROIC, and pricing power instead of brand stories.
Foundations Start here
Beating the market means outperforming the S&P 500 after costs. Here is the math of why most investors fail and what disciplined stock picking demands.
Stock analysis Start here
A step-by-step framework to analyze a stock: business quality, earnings, cash flow, balance sheet, and valuation, with the metrics to check at each step.
The Index Reality Check Start here
Index funds promise the whole market. Cap weighting, concentration, and hidden costs shape what you really own. A factual tour for passive investors.
Stock analysis
Free cash flow is the cash a business keeps after paying its bills and investments. Here is how to calculate it and why it matters.
No article in this topic yet.